THE PROBLEM
This Natural Resources and Environmental Control team is tasked with serving the residents and businesses of a specific State through drainage issue remediation, which are often funded by Federal and State grants, as well as smaller private grants.
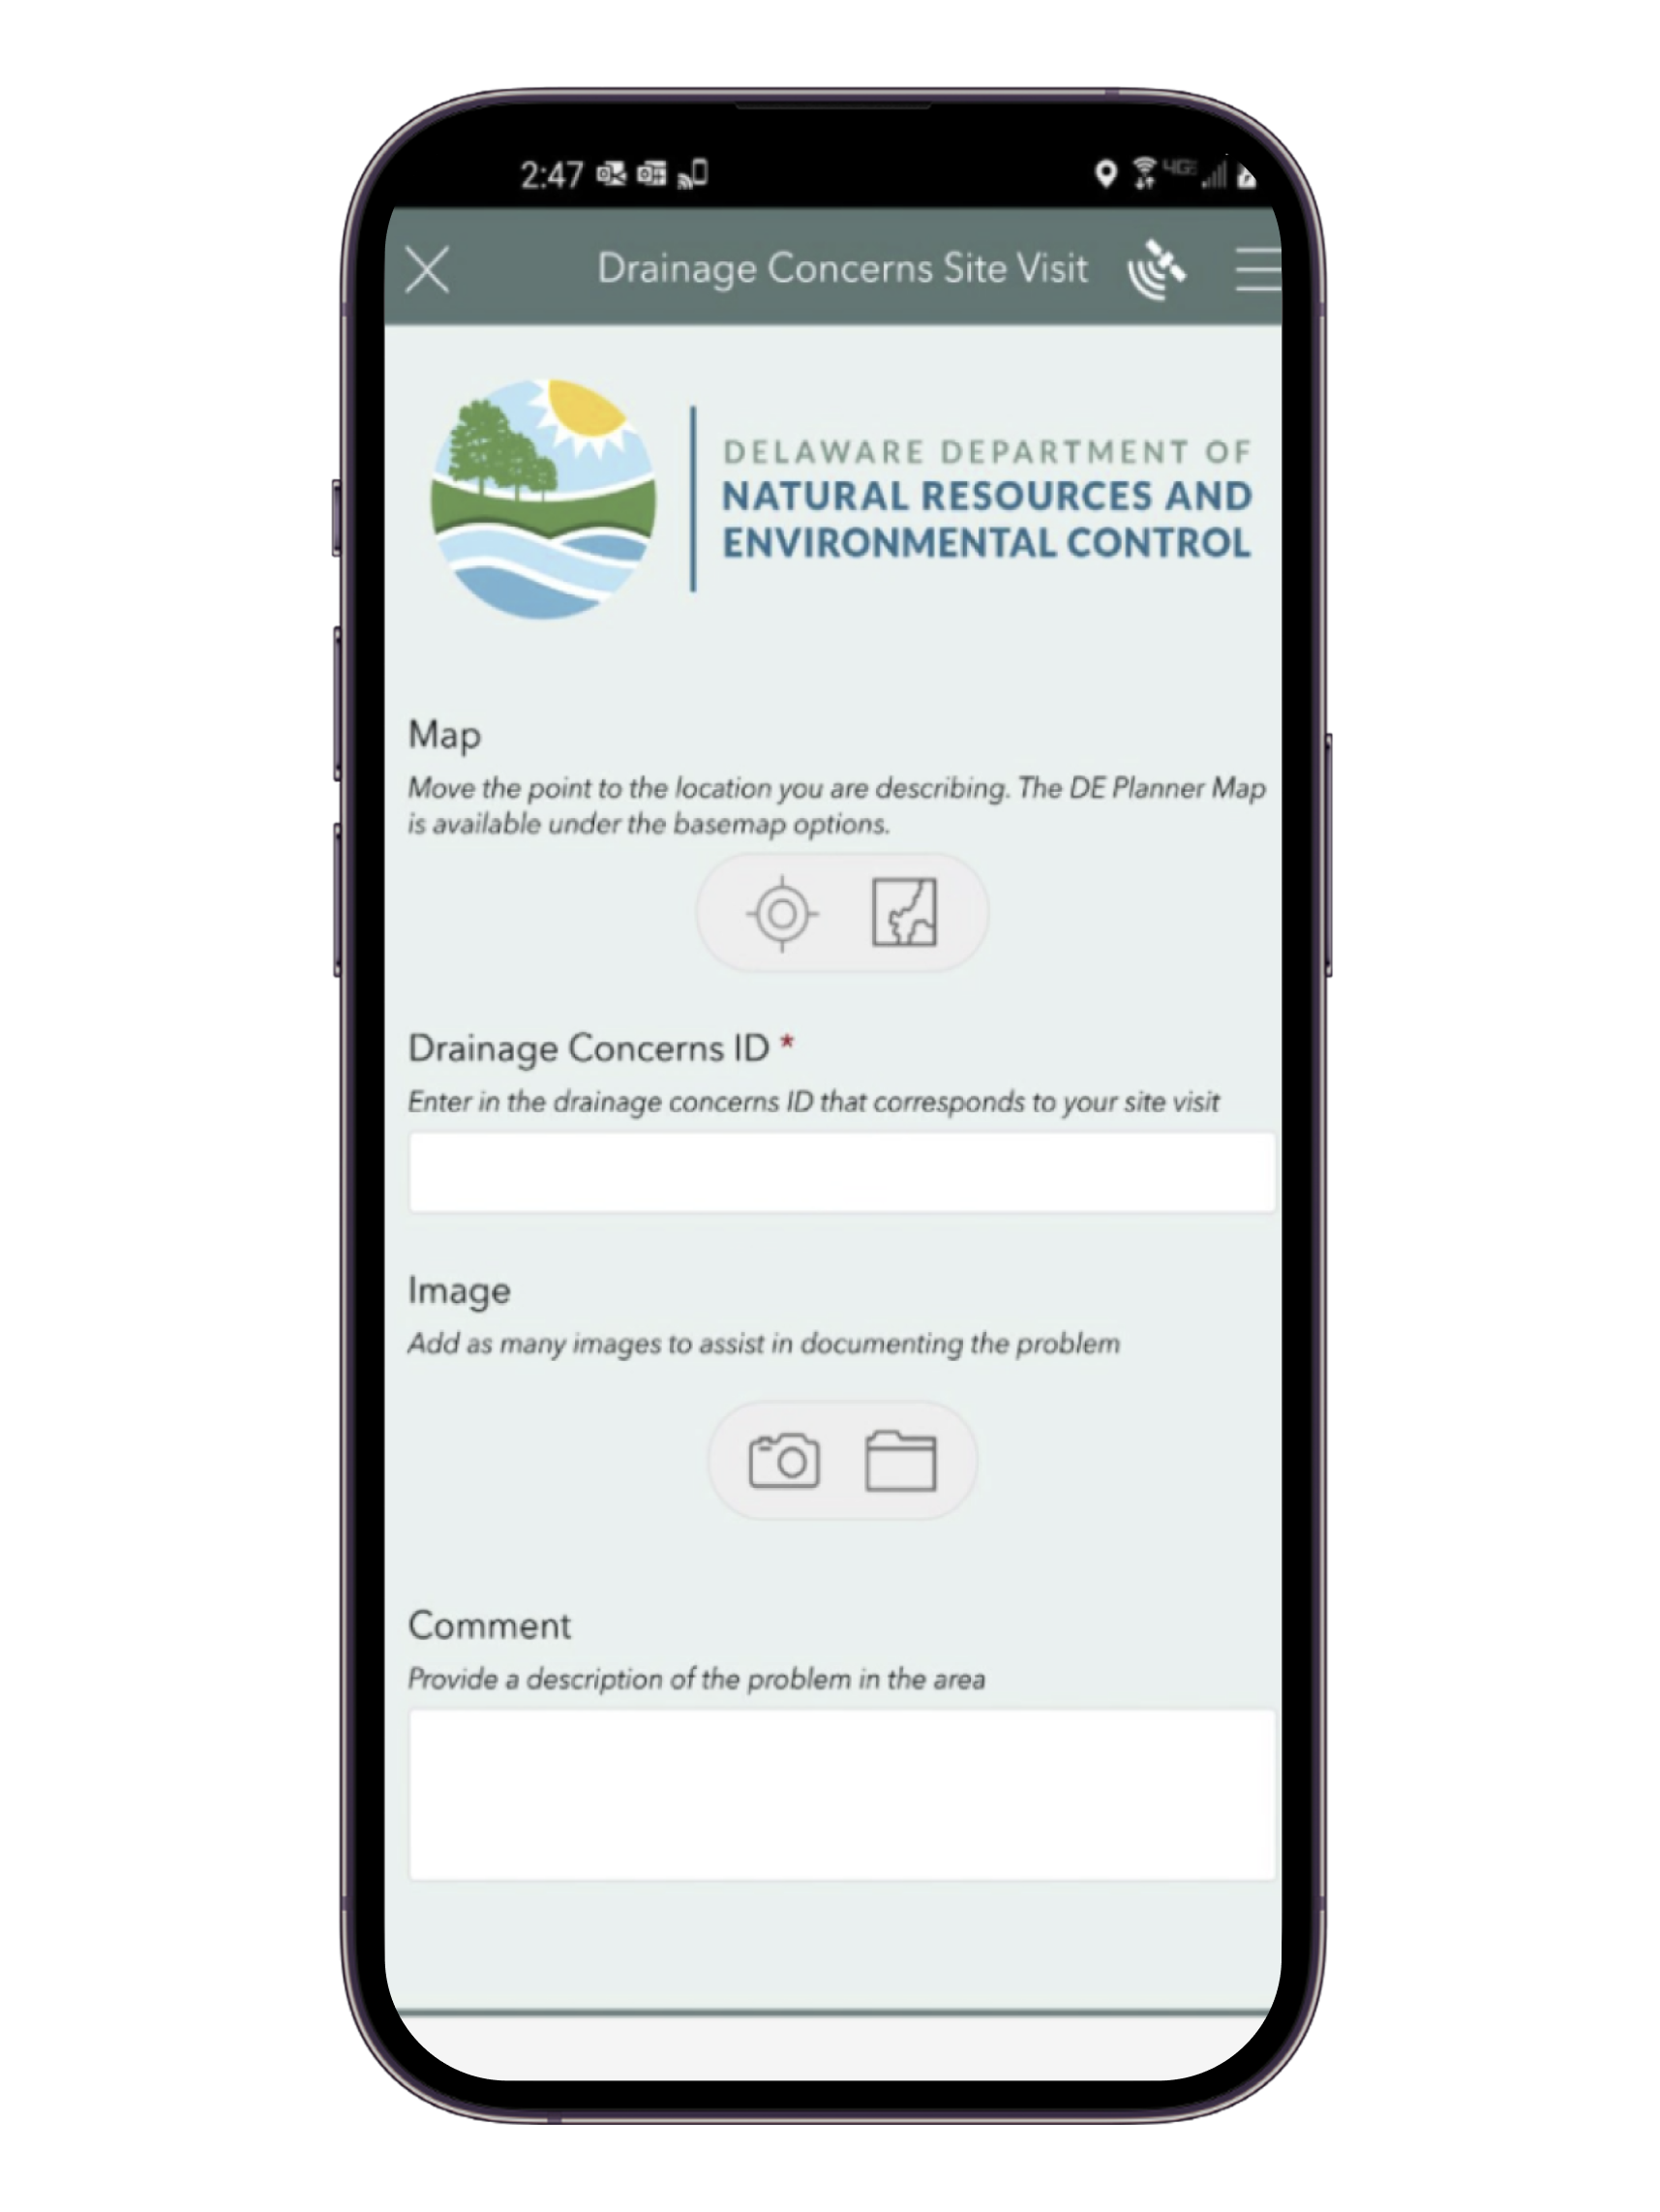
Previously, field data was collected the old fashioned way- pen and paper, with some notes recorded on personal cell-phones. This new app will allow field crew to quickly and efficiently record data. The new app will also allow for a reduction in incorrect or lost data, through human error or physical loss of notes. This data will not have to be manually entered into the online servers- it will be transferred directly from the app to the server.
THE SOLUTION
As an environmental scientist that regularly deals with grants (both local and national), it's crucial that I find areas within the State that can benefit from money and efficiently submit an application on their behalf. There are many underserved areas within Delaware, and creating a dashboard to more easily illustrate possible projects for grant applications is crucial and allows for more timely attention to issues.
MY ROLE
My role in this project was UX Designer, Researcher, UI Designer, and Product Engineer. I completed most parts of this project, from ideating, to research, to design and prototyping, through creation of the dashboard and site. I was the lead designer, but I worked very closely with co-workers and other division leaders for input and re-iterations.
TOOLS
Procreate, Pen and Paper, Microsoft Powerpoint, Microsoft Excel, Figma, ESRI
WIREFRAMING
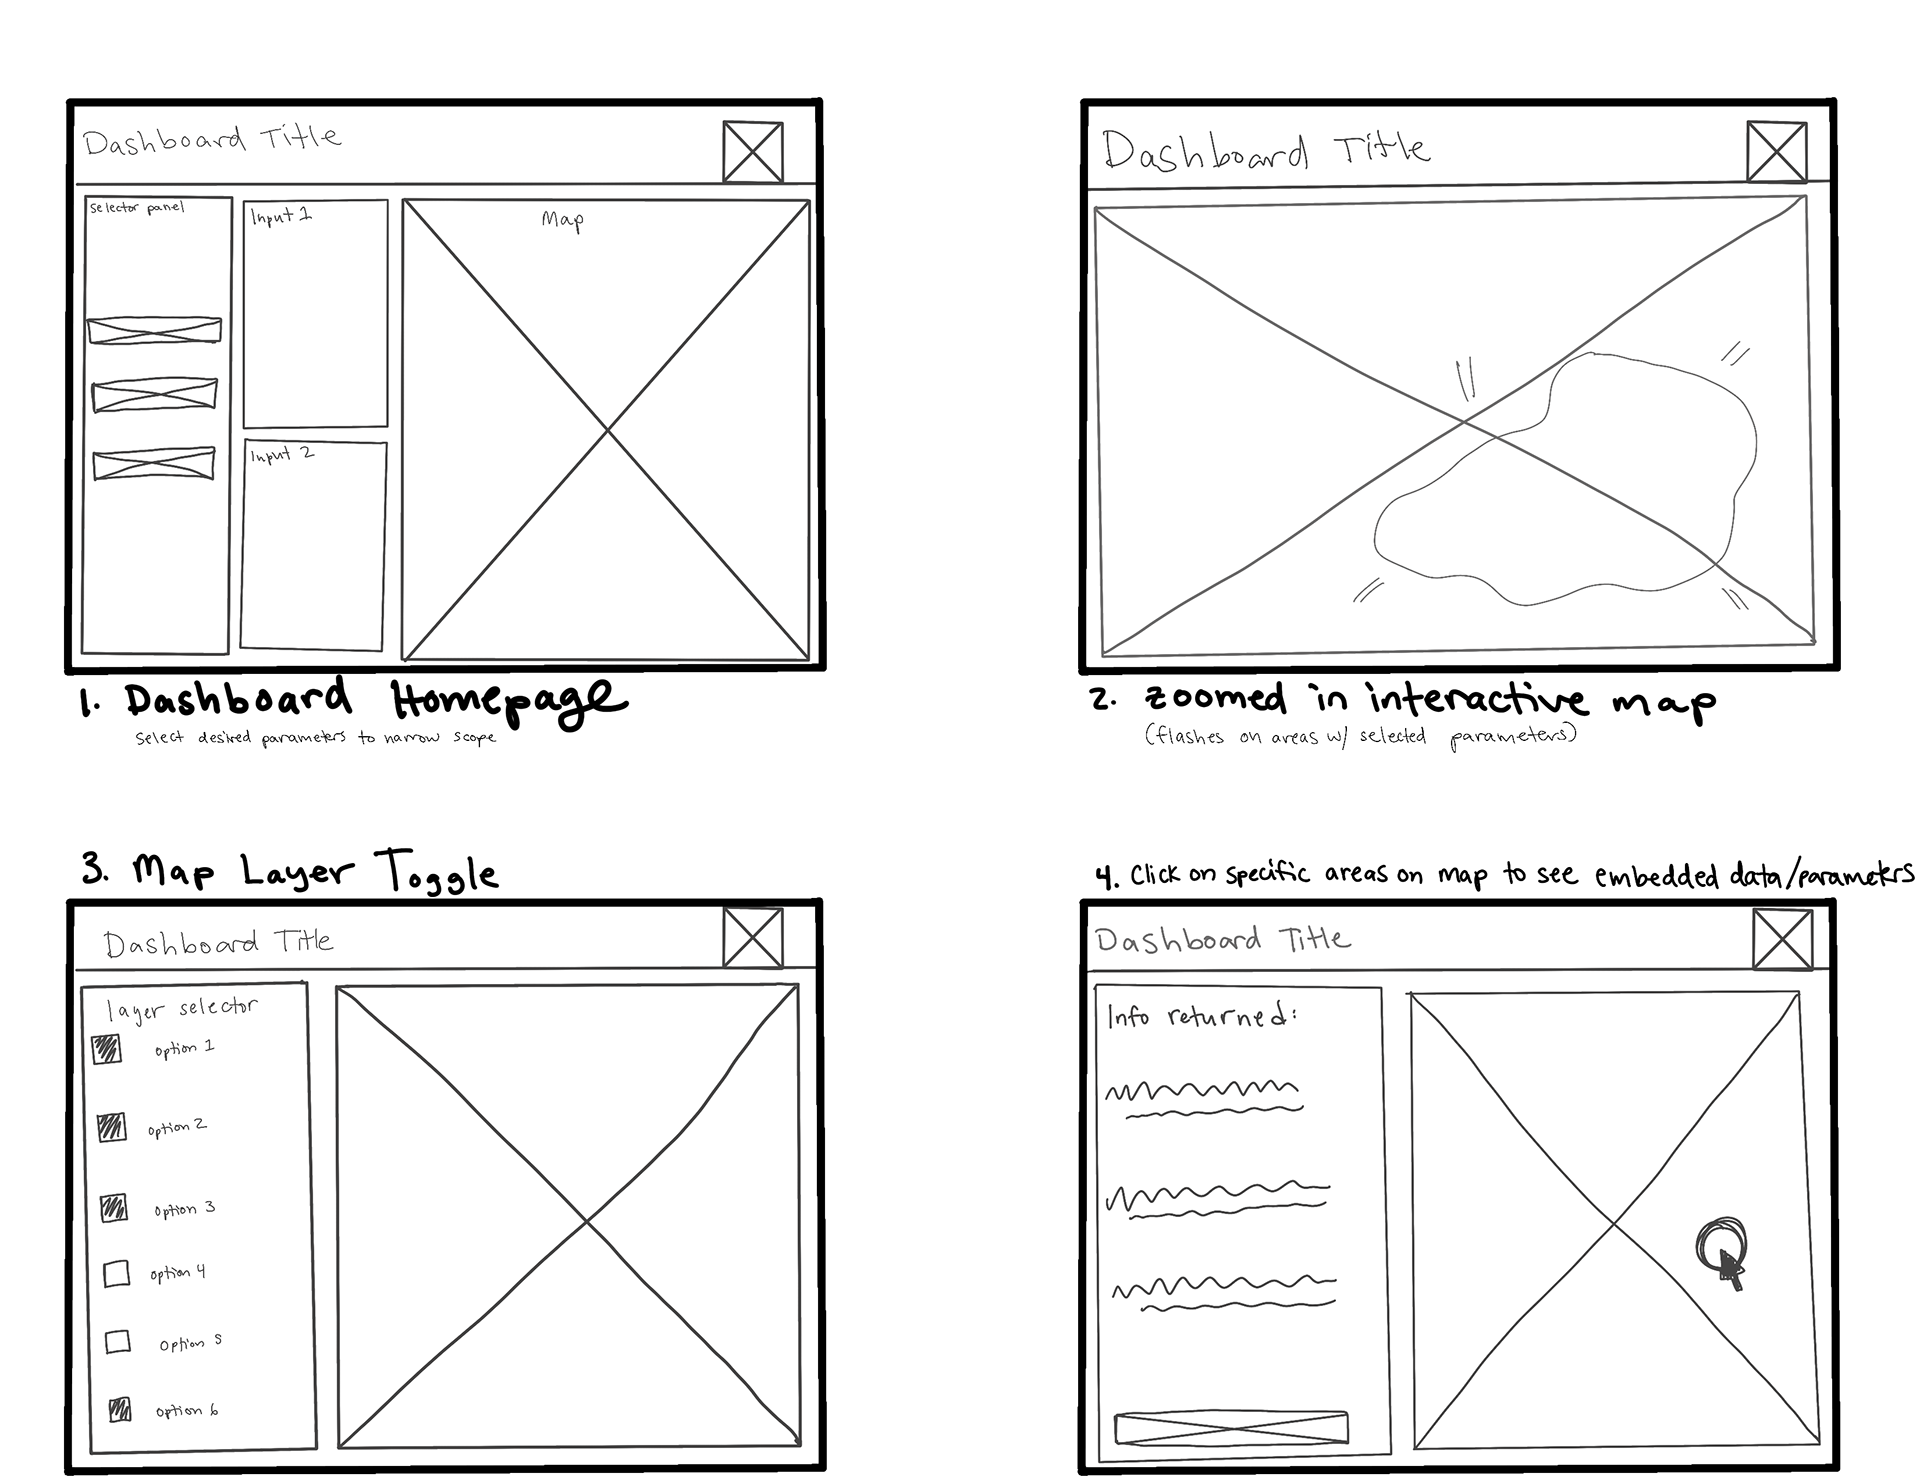
For this aspect of the design, I made sure to minimize the amount of "pages" that the user would need to interact with to find the desired data. I kept the design simple and focused on the map (produced through ESRI GIS software) in order to keep it interactive yet informative.
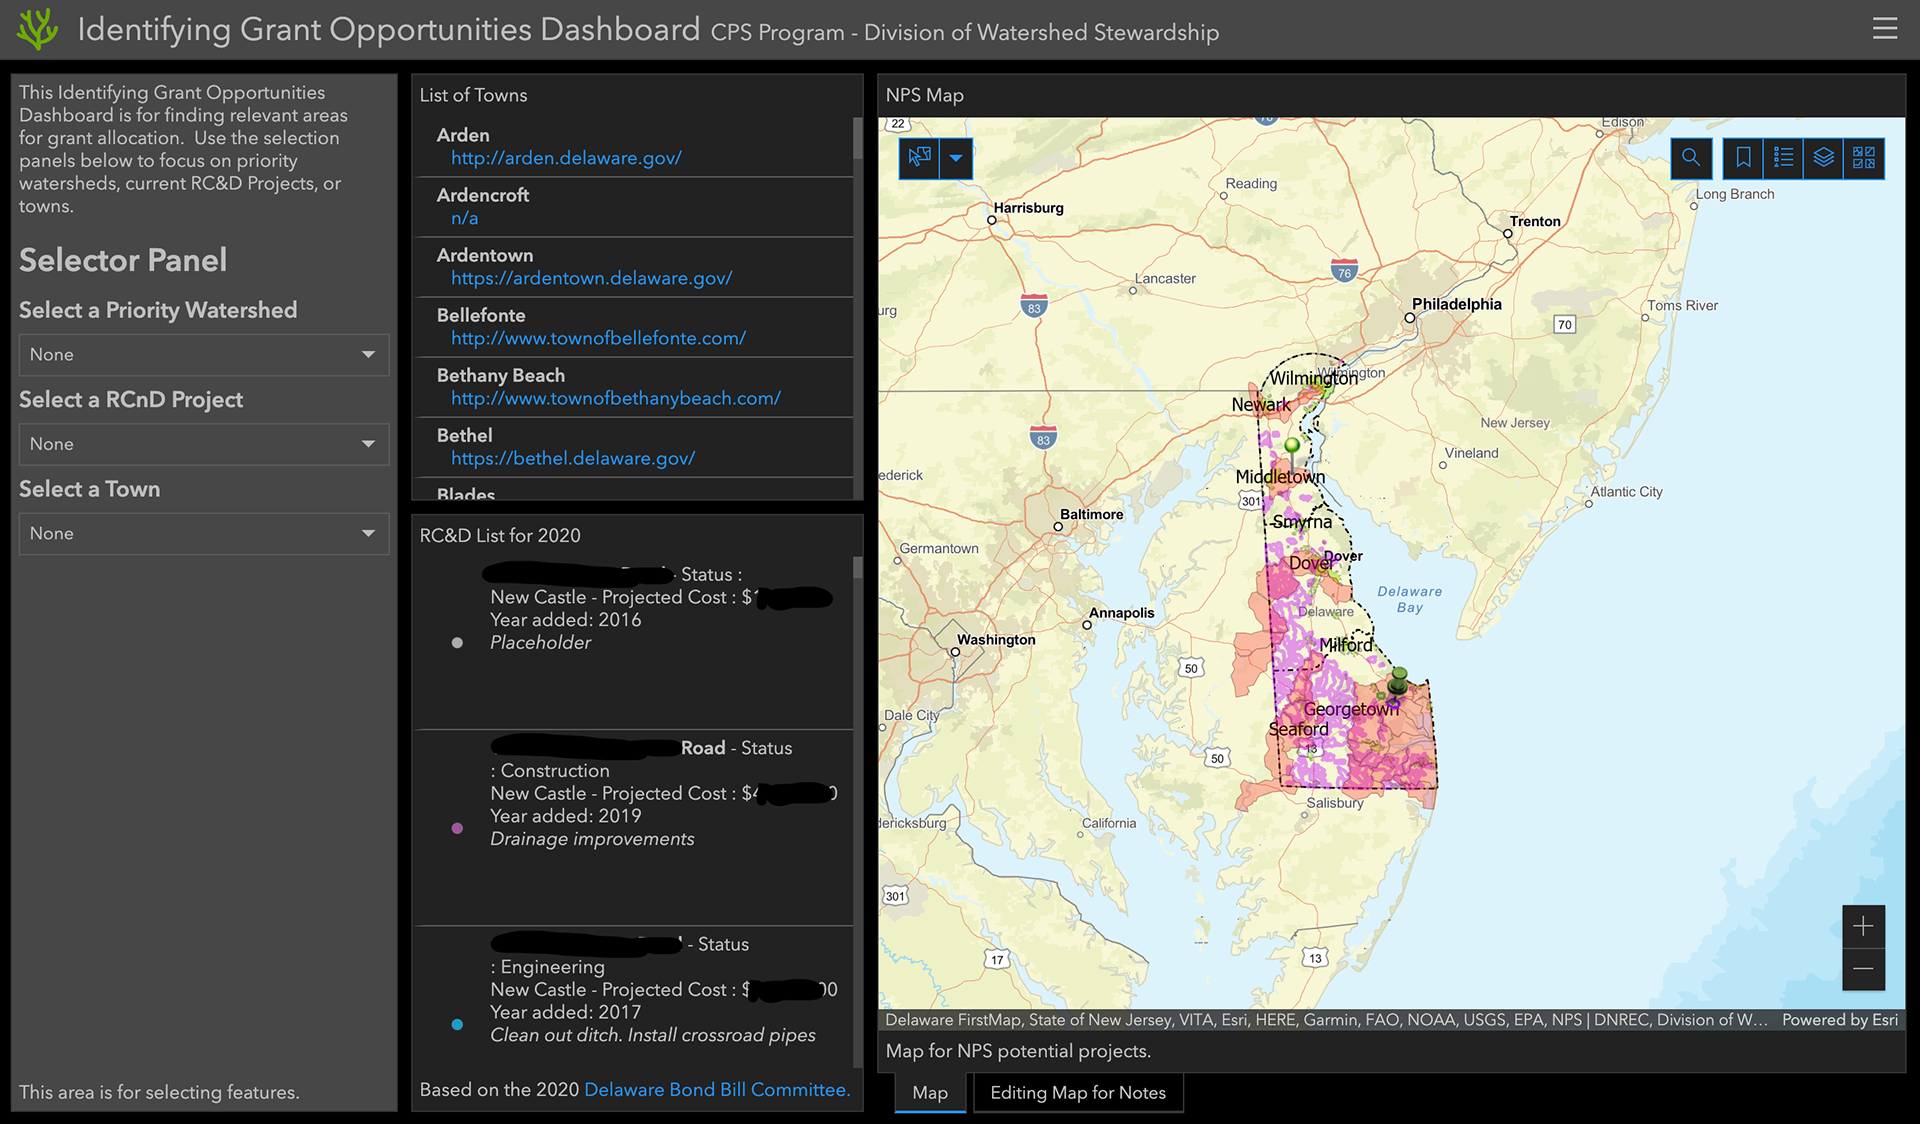
FINISHED PRODUCT
This design was finished by compiling data on the back end and loading it onto the site servers. From there, the user can access the information that they seek through the toggles and interactive selectors on the dashboard home page. An example of use for this dashboard would be: finding active projects within a certain watershed in the Delaware, that is also NOT within an established municipality. This allows for the user to quickly access data, which is constantly fed back into the system as it is received, so it is always up-to-date.
Due to permissions granted by higher-ups, everything that I'm able to share can be found on this page. Confidential data within these figures/screenshots has been covered.
CONCLUSION
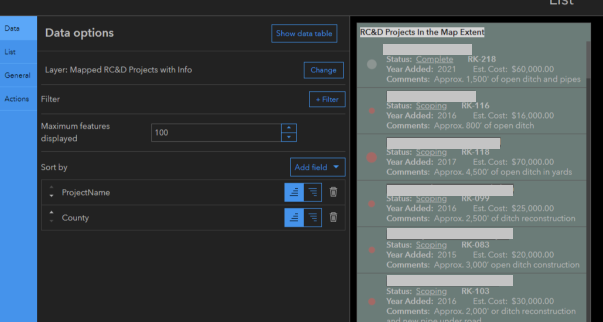
Filter by Project Name, County, Project Cost, and more. This allows for faster and more accurate sorting, in order to pinpoint projects and begin grant application process(es) in order to more efficiently serve residents of the State. Multiple grants have been awarded to the State's Division, due to the more streamlined approach that these dashboards and websites provide.